
Skip to content
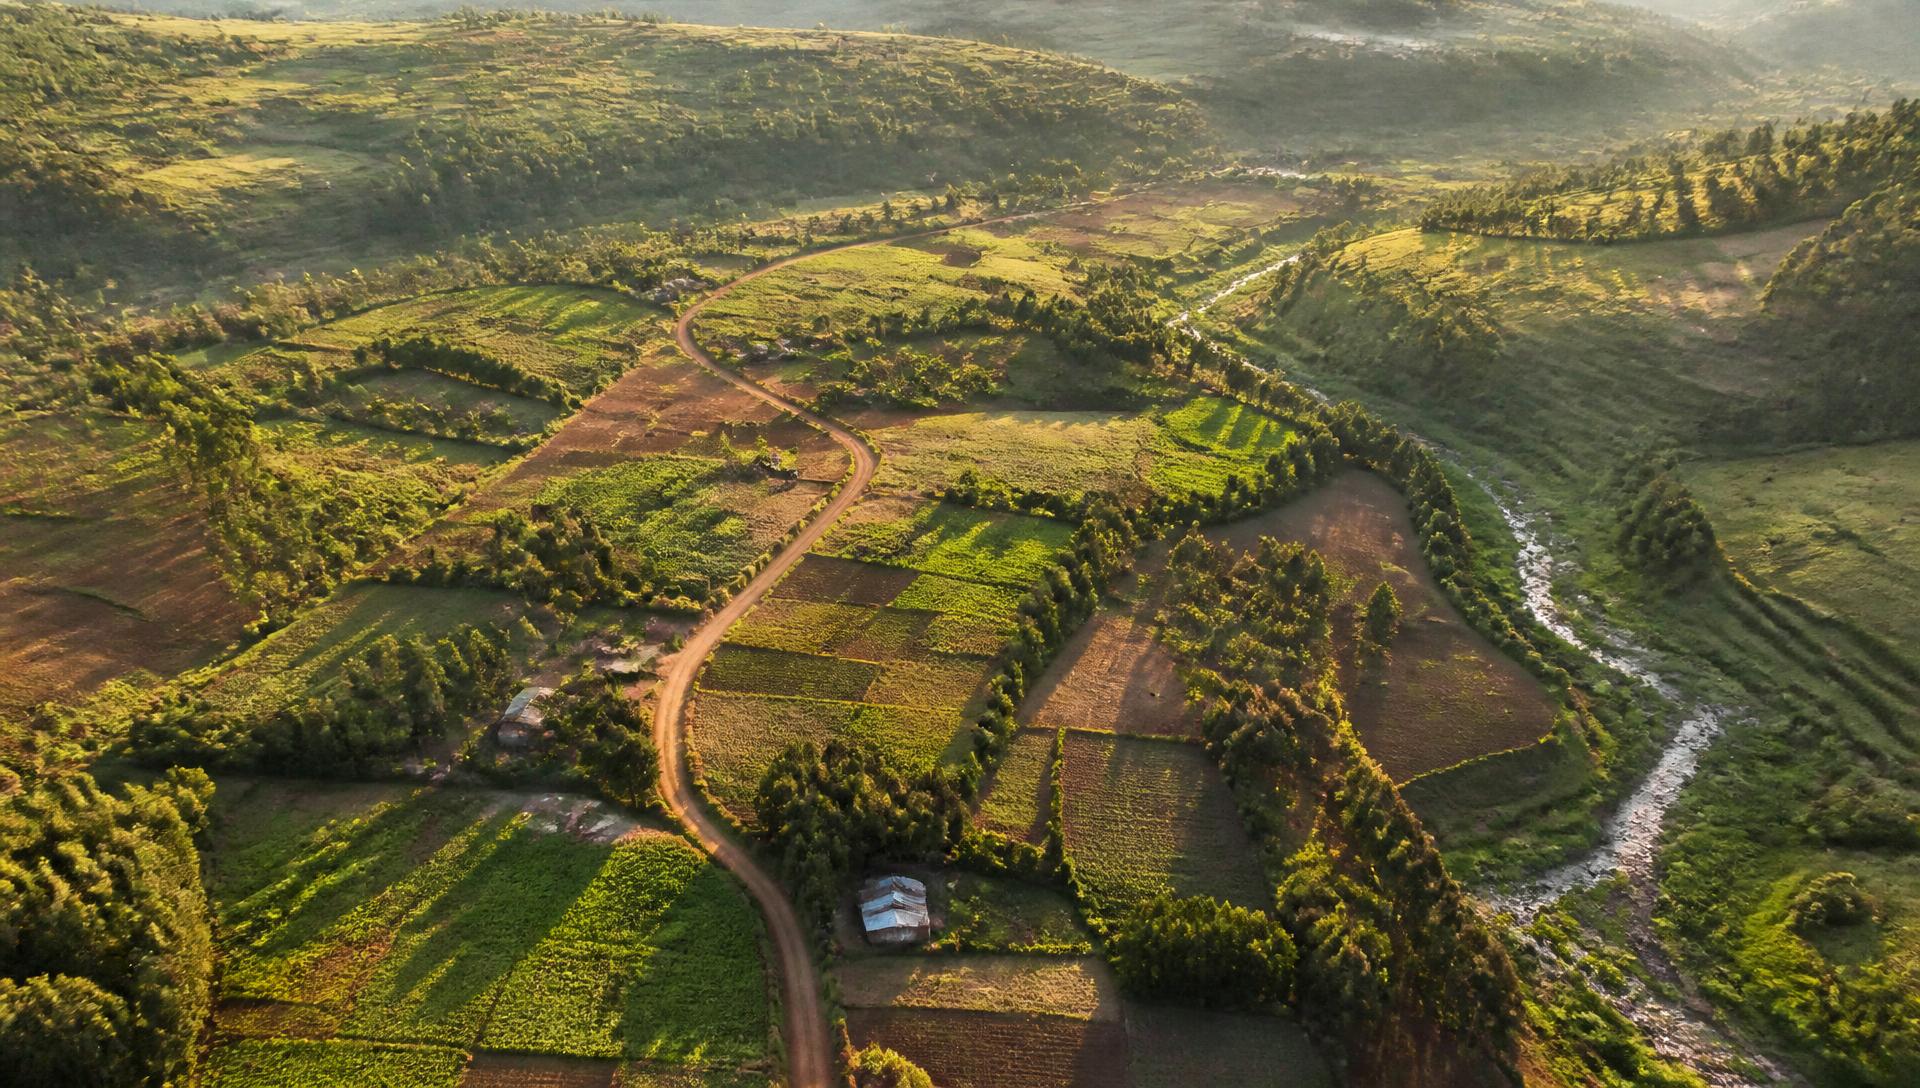
Aerial view of Kenyan farmland used as the setting for the demonstration.

What an Evidence Pack looks like.

This walkthrough shows the structure of a Mavuno Evidence Pack using illustrative content. Choose a question below to see how the pack is put together.

ILLUSTRATIVE PRODUCT DEMONSTRATION — NOT A LIVE ASSESSMENT

The satellite images are genuine Copernicus Sentinel-2 observations of the real Kenyan places named on each scenario. Every value shown here is illustrative demonstration content created to show the structure of a Mavuno Evidence Pack. It is not an observation of any real site and must not be used for any decision.

What recent rainfall and vegetation context surrounds this proposed supply area?

Mwea Irrigation Scheme, Kirinyaga County — illustrative scenario

Loading satellite image…

Sentinel-2 true-colour satellite image of the demonstration location.
Illustrative layers · real Sentinel-2 image

Switch layers on the image

Text description of the image: Scenario "Rainfall & vegetation context". The image is a real Sentinel-2 observation; the outlines, points and routes drawn over it are synthetic demonstration content: collection catchment, proposed facility, collection points, market corridor. Imagery: Copernicus Sentinel-2, when available.

Switch on what you want to see

Collection catchment

25 km catchment around the proposed facility.

What this may mean

Treat this as one input only. Confirm it against the enterprise's own records and a check on the ground before it informs any decision.

Sources used

  • Sentinel-2 — Optical imagery for vegetation indicators (Open data)
  • CHIRPS — Rainfall accumulation and anomaly context (Open data)
  • Enterprise-declared geography — Facility point, collection points and stated radius (Provided with consent)

The illustrative supply basin is described as a 25 km collection catchment around a proposed aggregation and cooling point.

In this demonstration, the vegetation signal is concentrated along the western section of the catchment, while the eastern section shows a consistently lower signal across the demonstration period.

A reviewer using a real pack would use this section to decide whether the throughput assumption is geographically plausible, and which parts of the basin need operator confirmation.

Evidence objects

Each finding, and where it came from.

Confidence in this demonstration reflects how directly each observation answers the stated question, not a statistical accuracy measure. Mavuno does not publish accuracy metrics that have not been validated.

Sentinel-2 (illustrative)Confidence: moderate

Vegetation index summary across the catchment

Location
25 km collection catchment
Observation date
Demonstration period — composite window
Interpretation
In this demonstration the higher-signal area covers roughly the western third of the catchment, suggesting that productive land is unevenly distributed rather than spread across the full collection radius.
How we got there
Cloud-masked optical composite → index computation → catchment zonal summary → review against the declared collection radius.
Limitation
A vegetation index describes greenness, not crop type, yield or ownership. It cannot confirm that observed vegetation is commercially available to the facility.
Next check
Confirm with aggregators which parts of the catchment actually supply the facility today.
CHIRPS (illustrative)Confidence: indicative

Rainfall accumulation and anomaly context

Location
Catchment and surrounding area
Observation date
Demonstration period — recent seasons
Interpretation
The demonstration shows accumulation below the recent multi-year pattern for the most recent season, with the shortfall concentrated in the eastern part of the catchment.
How we got there
Gridded rainfall series → seasonal accumulation → comparison against the recent multi-year reference → catchment summary.
Limitation
Gridded rainfall estimates smooth local variation and can differ materially from a gauge reading at a specific point.
Next check
Compare against any local rainfall records or station data the enterprise can provide.
Enterprise-declared points (illustrative)Confidence: supported

Spatial relationship between collection points and the facility

Location
Collection network
Observation date
As declared in the demonstration scenario
Interpretation
Declared collection points cluster within 12 km of the facility in this demonstration, with two outliers beyond the stated collection radius.
How we got there
Declared point set → distance computation from the facility → review against the stated collection radius.
Limitation
This describes declared locations only. It does not verify that each point is operational or that stated volumes are accurate.
Next check
Verify the two outlying points and their assumed contribution to throughput.

Limitations

  • No observation here is a live measurement of any real site.
  • Optical indicators are affected by cloud cover, seasonality and mixed land cover.
  • Satellite information cannot confirm ownership, contracts, volumes or commercial availability.
  • This pack supports diligence. It does not replace it.

Suggested next checks

  1. 01Confirm the operating collection radius with the enterprise.
  2. 02Validate declared volumes against delivery records.
  3. 03Discuss the eastern low-signal area with local operators.

A real pack follows exactly this structure over a geography agreed with you, using observations of that geography rather than the illustrative content shown here.

Want this run on a real question?

Tell us the decision, the business or the portfolio. We will confirm whether Mavuno can add useful evidence before any work begins.