Skip to content
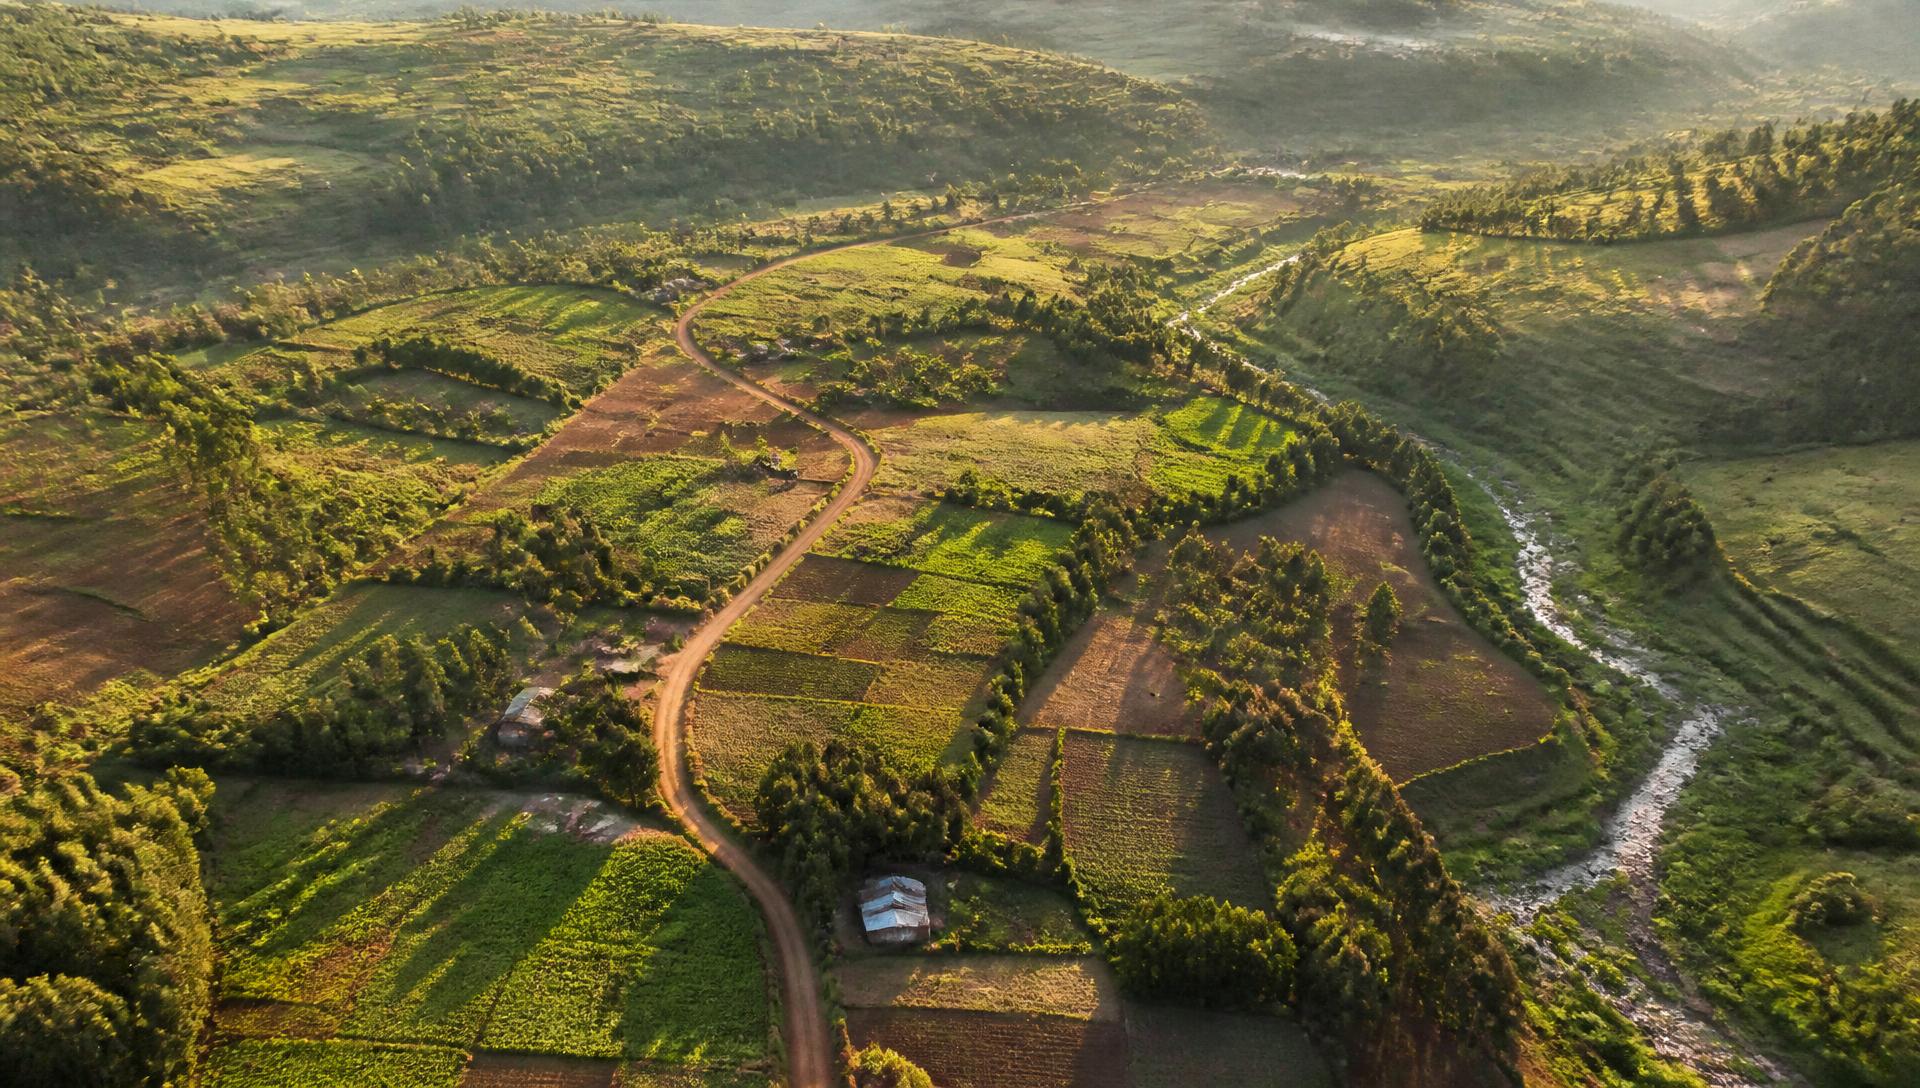
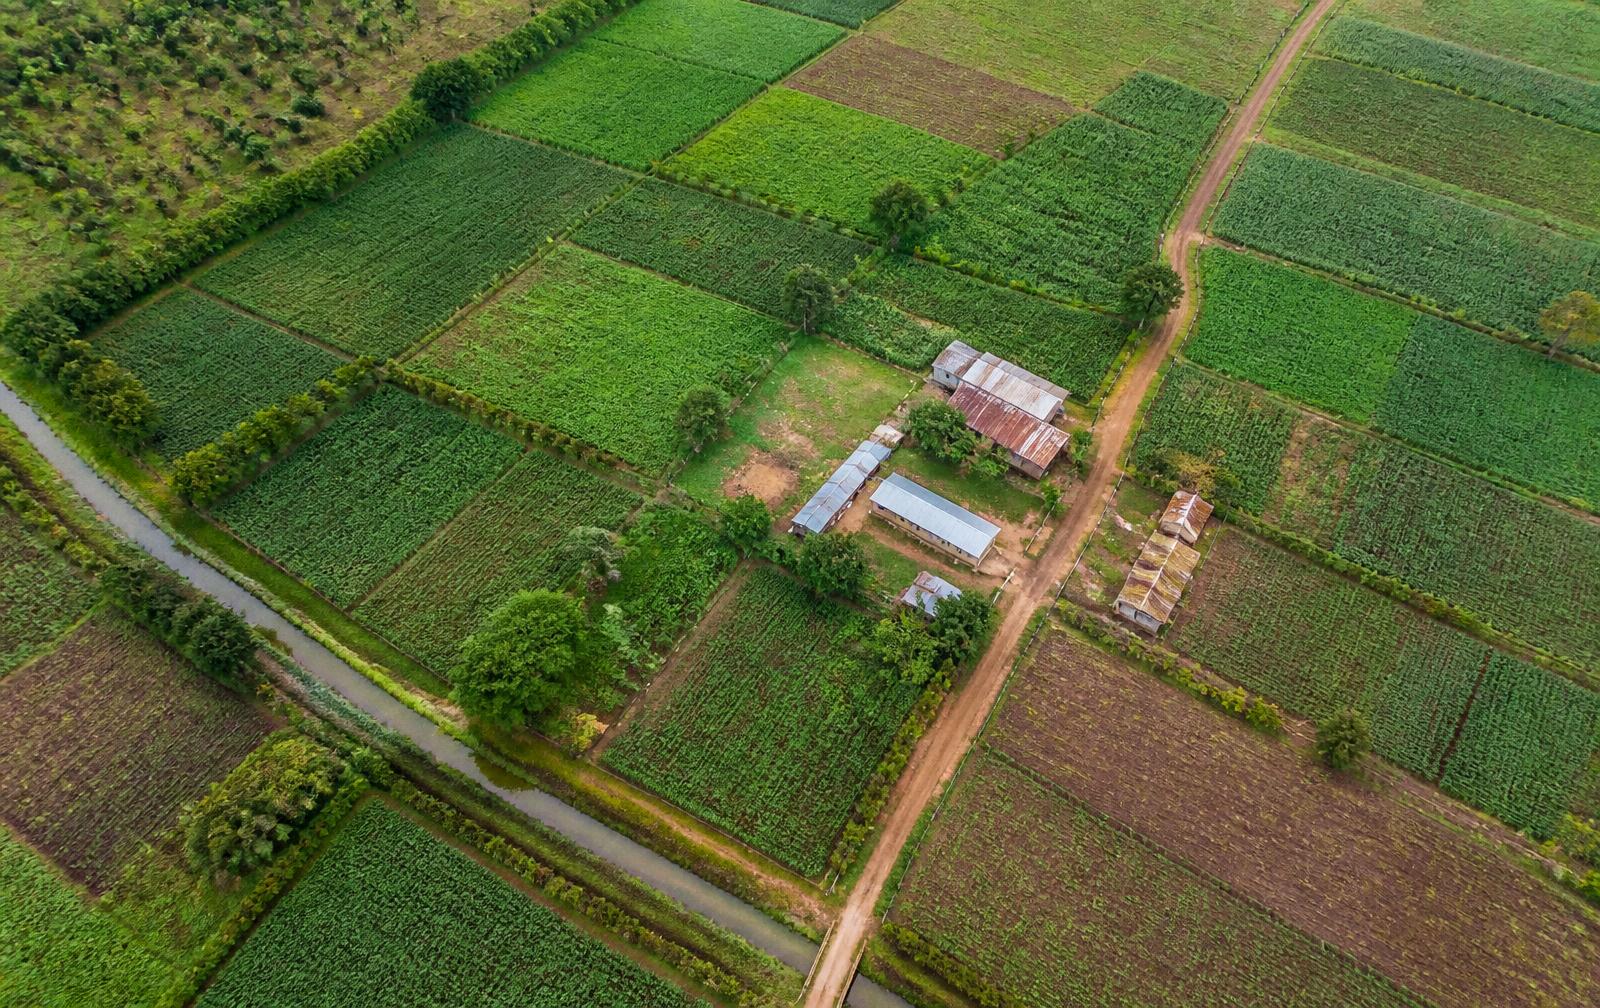
Aerial view of Kenyan highland farmland, with fields, a road and a river.

See the real world behind the business.

Mavuno helps businesses, investors and lenders understand what is happening on the ground, by bringing together location, weather, satellite and business information.

Country context

Kenya — illustrative view

The problem

A business plan only tells part of the story.

Financial statements, proposals and business plans matter. But they cannot show what is happening around the business itself — the land, the weather, the suppliers, the distance to market. Site visits show one day, at high cost. Mavuno helps add the missing context.

Mavuno adds evidence to a decision. You still make the decision.

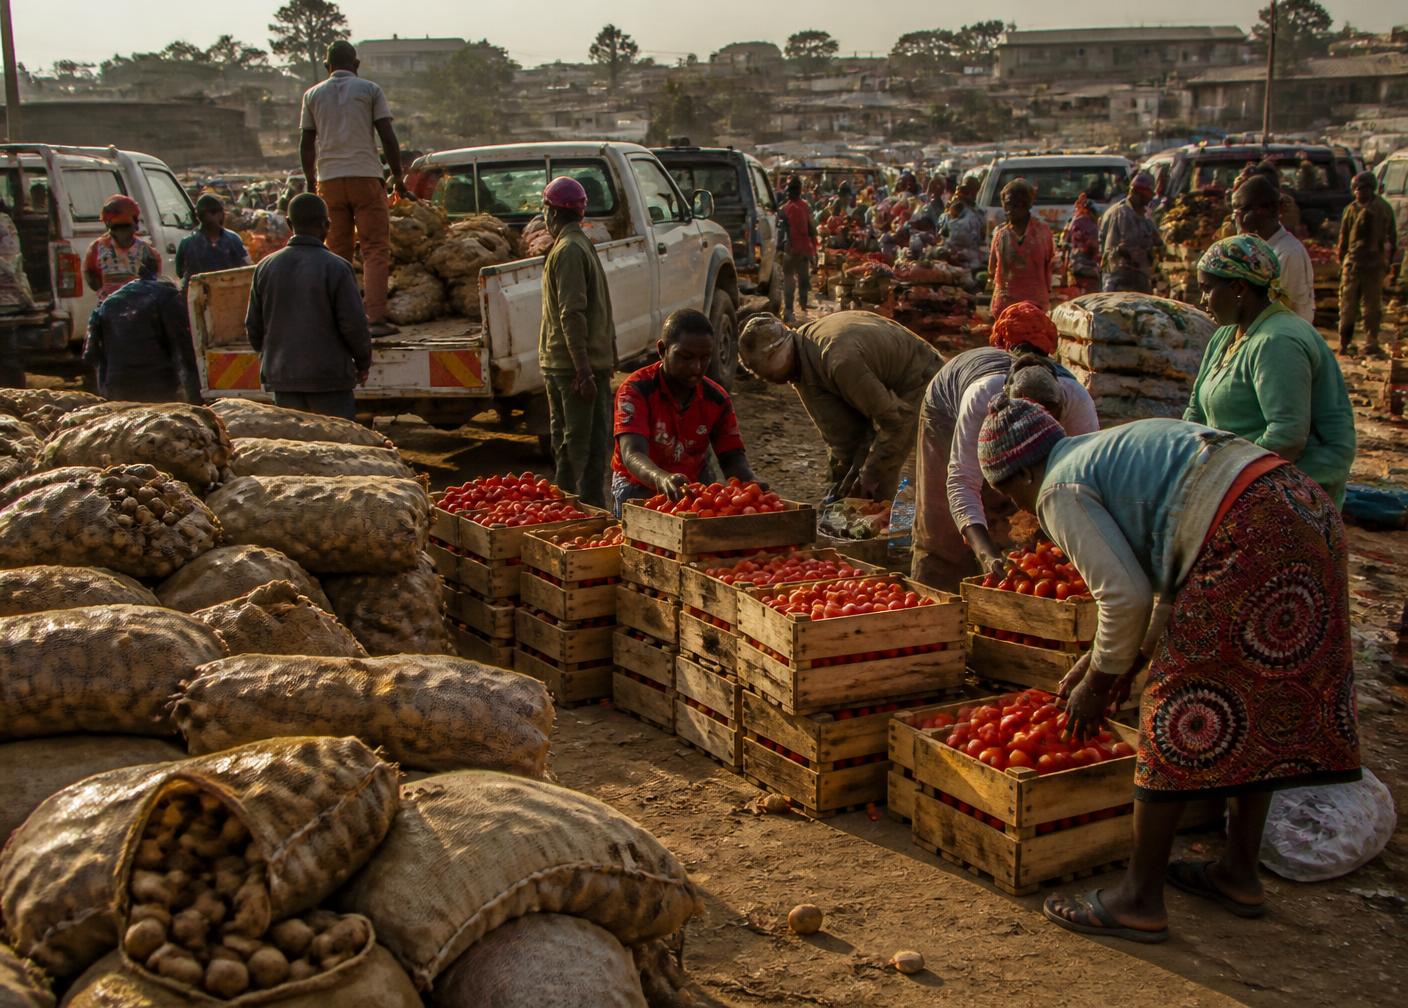
Traders loading crates of produce at a Kenyan market at dawn.
Market is 28 km away.
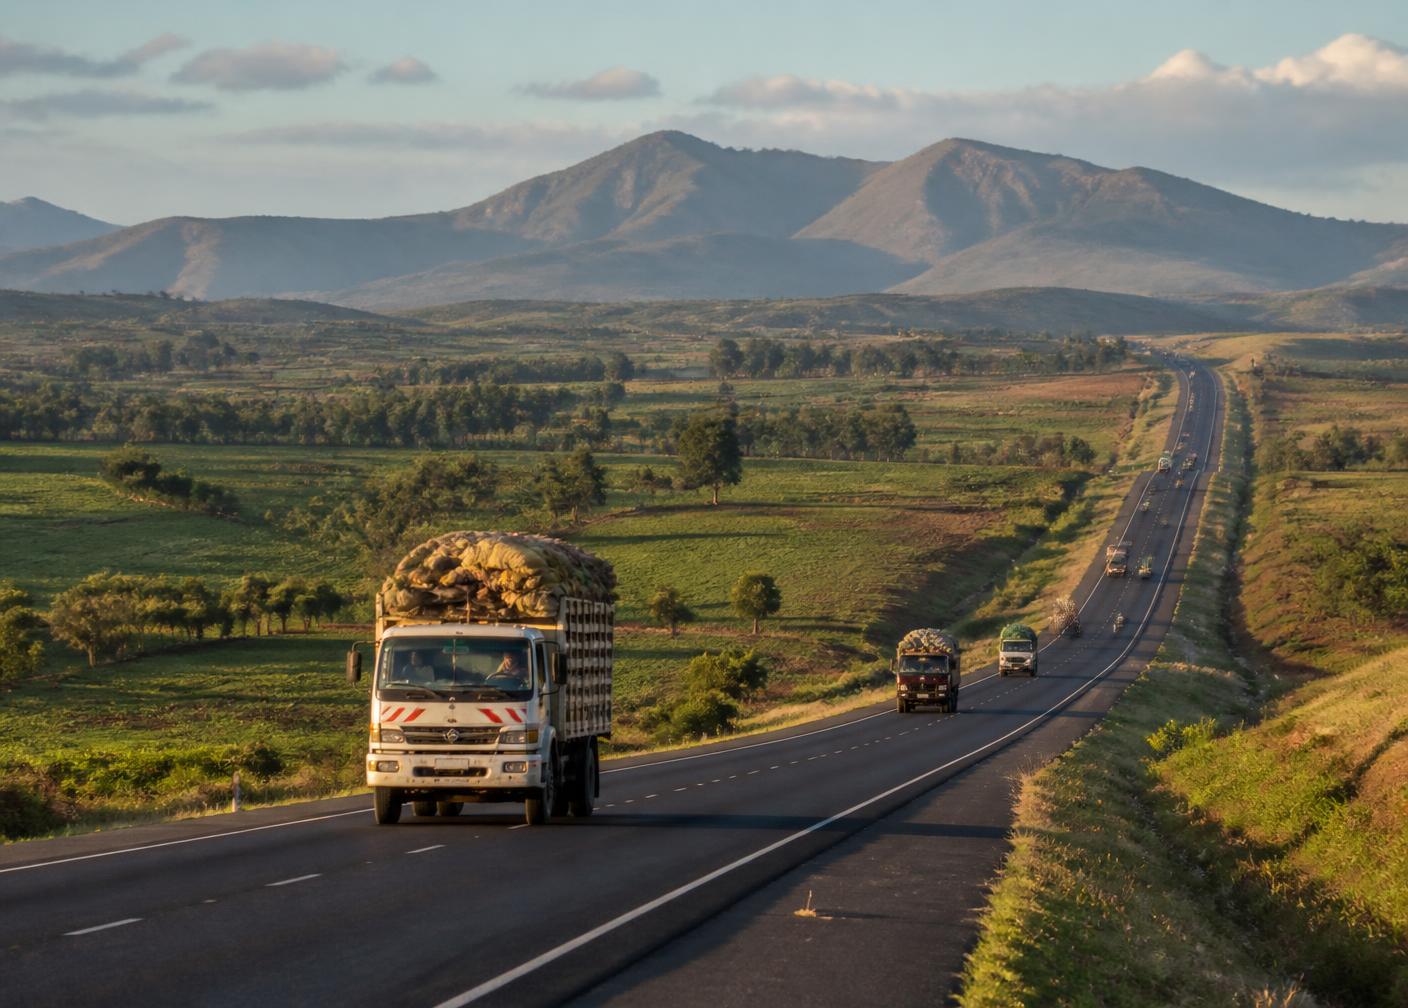
Main route to Nairobi.

The paperwork says supply is reliable. The place tells you whether it can be.

01

Where is production actually happening?

See the site, the farm blocks or the service area on a map, and how much of it shows real activity.

02

What surrounds the business?

Rainfall, seasons, land conditions and the places nearby that shape how the business performs.

03

Where are suppliers and markets?

How far supply travels, which routes matter and how easily the business can reach its customers.

04

What should you check next?

Every pack says plainly what the information shows, what it cannot show and what to confirm on the ground.

The bigger picture

From the bigger picture to the business decision.

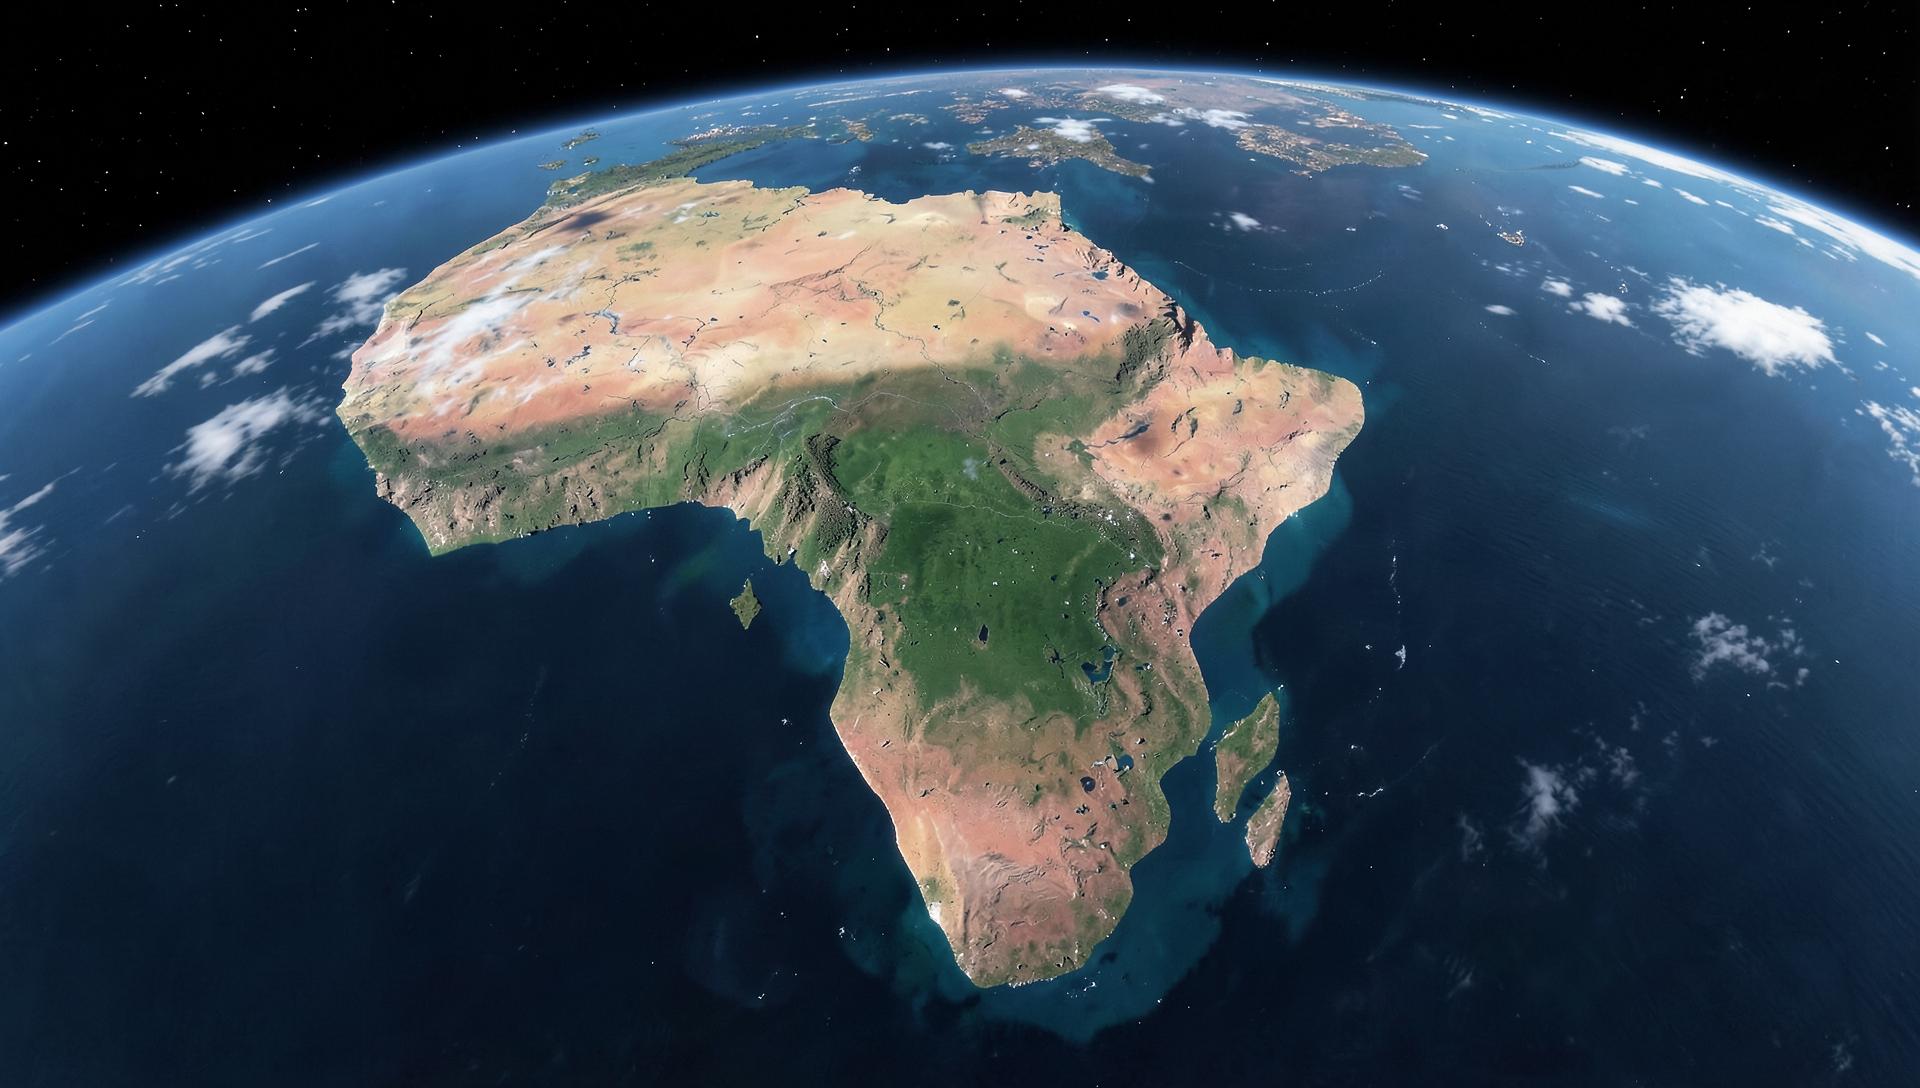
Satellite view of the African continent from orbit.

Africa

Every business operates somewhere.

Where a business sits already explains a great deal about how it produces, sources and sells.

Illustrative product demonstration — not a live assessment

The Evidence Lens

See what changes when you look beyond the documents.

Mavuno adds location, weather and operating context to the information a business already provides. Move the lens across the landscape and that context appears: the farm area, the supply area, the road to market, recent rainfall and vegetation.

ILLUSTRATIVE PRODUCT DEMONSTRATION — NOT A LIVE ASSESSMENT

Aerial view of Kenyan farmland, with an evidence layer revealed beneath a moving lens.Move, drag or use arrow keys
  • Farm area
  • Supply area
  • Main road
  • Market
  • Recent rainfall
  • Vegetation
  • Distance to market
Illustrative geometry over an aerial view. Nothing here describes a real business.

The Evidence Pack

A simple Evidence Pack for an important business question.

Maps, observations and plain explanations of what they mean. This example shows how a pack is put together. It is a demonstration, not a look at a real business.

ILLUSTRATIVE PRODUCT DEMONSTRATION — NOT A LIVE ASSESSMENT

Business question

What recent rainfall and vegetation context surrounds this proposed supply area?

Mwea Irrigation Scheme, Kirinyaga County — illustrative scenario

Loading satellite image…

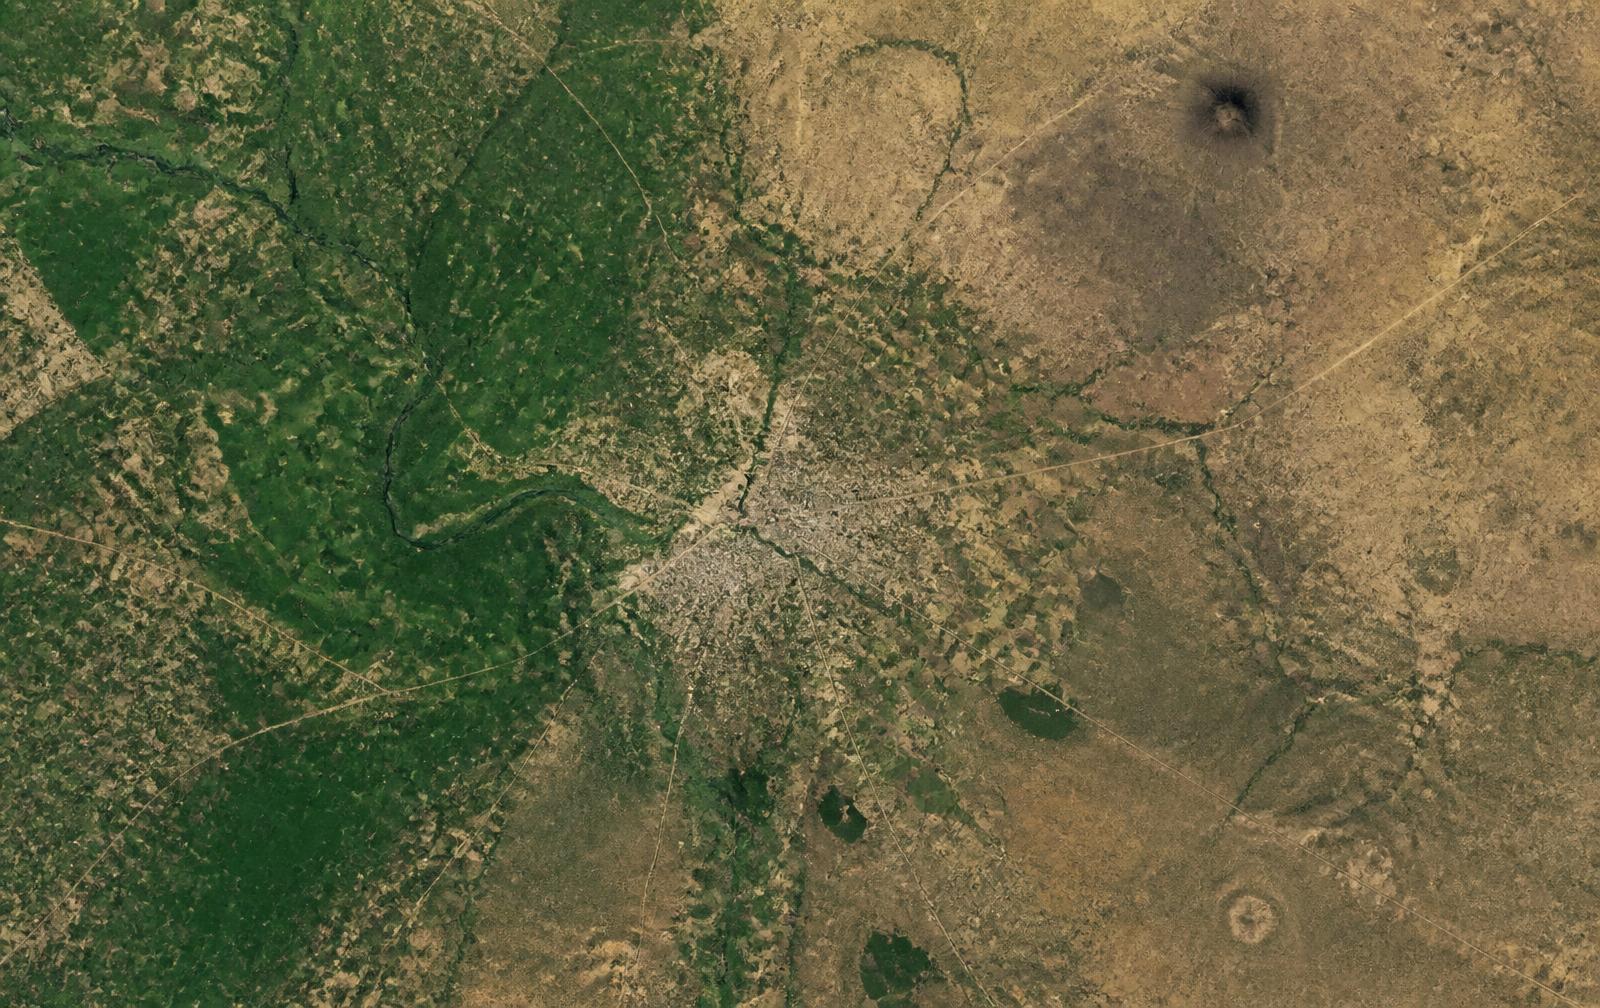
Sentinel-2 true-colour satellite image of the demonstration location.
Illustrative layers · real Sentinel-2 image

Switch layers on the image

Text description of the image: The image is a real Sentinel-2 observation. The collection catchment, facility point, collection points and market corridor drawn over it are synthetic demonstration content. Imagery: Copernicus Sentinel-2, when available.
Sentinel-2 (illustrative)Confidence: moderate

Vegetation index summary across the catchment

Location
25 km collection catchment
Observation date
Demonstration period — composite window
Interpretation
In this demonstration the higher-signal area covers roughly the western third of the catchment, suggesting that productive land is unevenly distributed rather than spread across the full collection radius.
How we got there
Cloud-masked optical composite → index computation → catchment zonal summary → review against the declared collection radius.
Limitation
A vegetation index describes greenness, not crop type, yield or ownership. It cannot confirm that observed vegetation is commercially available to the facility.
Next check
Confirm with aggregators which parts of the catchment actually supply the facility today.
CHIRPS (illustrative)Confidence: indicative

Rainfall accumulation and anomaly context

Location
Catchment and surrounding area
Observation date
Demonstration period — recent seasons
Interpretation
The demonstration shows accumulation below the recent multi-year pattern for the most recent season, with the shortfall concentrated in the eastern part of the catchment.
How we got there
Gridded rainfall series → seasonal accumulation → comparison against the recent multi-year reference → catchment summary.
Limitation
Gridded rainfall estimates smooth local variation and can differ materially from a gauge reading at a specific point.
Next check
Compare against any local rainfall records or station data the enterprise can provide.
See the full example pack

The difference

The same business, seen two ways.

On one side, what usually arrives on a desk. On the other, the same business with its place, its supply area, its weather and its routes made visible.

Aerial view of a farming area used to compare a paper view with an evidence view.

Illustrative comparison. Mavuno adds context to the documents — it does not replace them.

How it works

Five steps, from your question to your answer.

  1. 01AskTell us the business question you need to answer.
  2. 02LocateWe define the site, farm, supply area, route or market that matters.
  3. 03UnderstandWe combine satellite, weather, location and relevant business information.
  4. 04ExplainWe turn it into simple maps, observations and explanations in plain language.
  5. 05DecideYou use the Evidence Pack alongside your own financial and operational information.
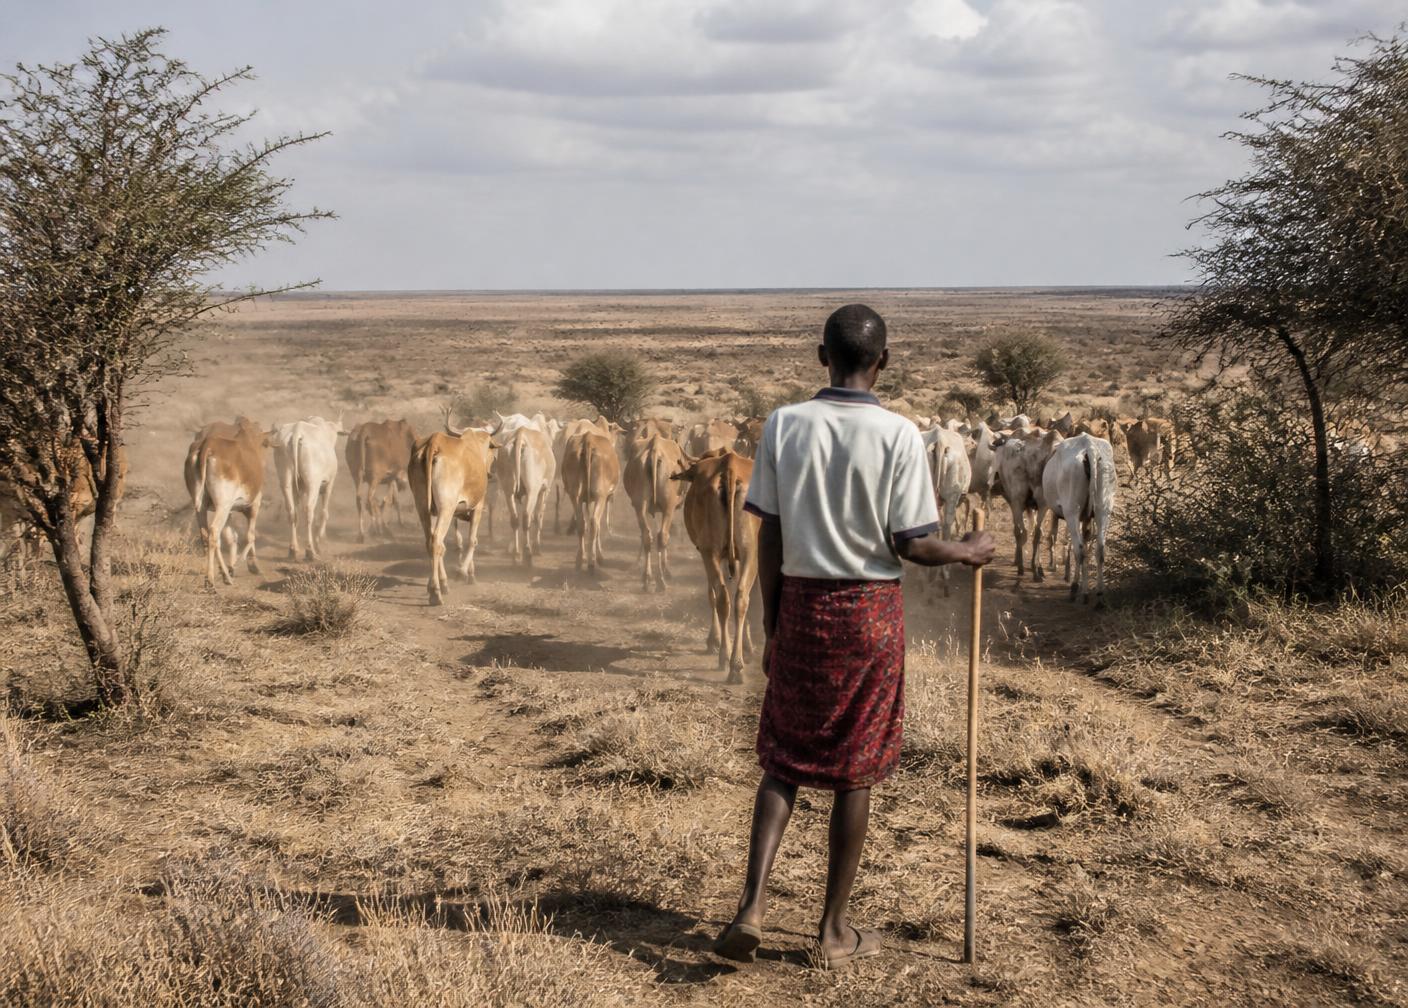
A herder moving cattle across dry rangeland in northern Kenya.
Rainfall matters here.

What Mavuno does not claim

  • Mavuno does not make lending, insurance, investment or buying decisions. People do.
  • We do not publish accuracy figures we have not tested.
  • Satellite and map information cannot confirm ownership, contracts or sales volumes.
  • The examples on this site are demonstrations, not assessments of real businesses.

Have a business question that depends on place?

Tell us the question and the place it concerns. We will say whether Mavuno can add useful evidence to it, and what it would not settle.